Fig. 5.

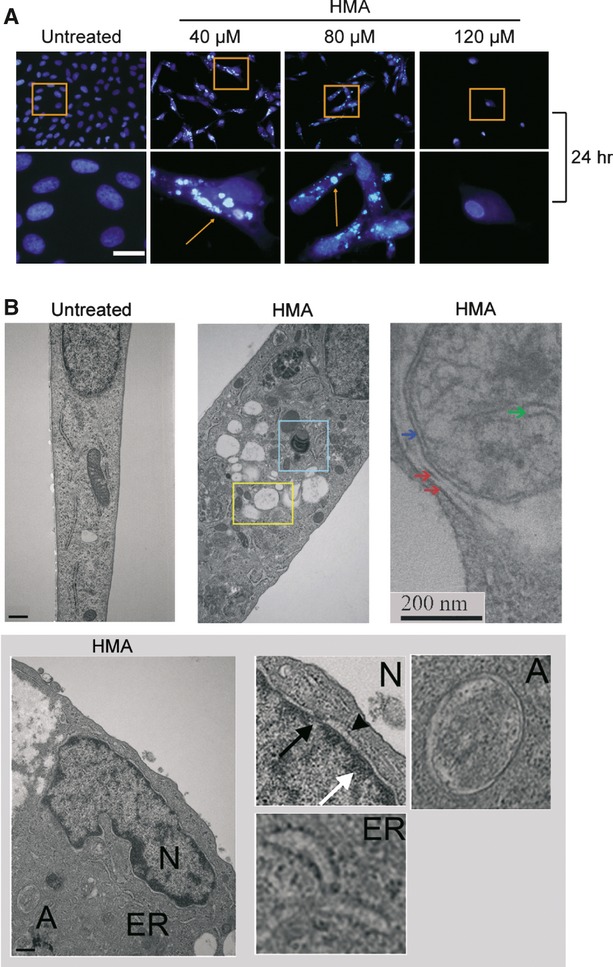
Morphological changes induced by HMA. (A) ARPE-19 cells were treated with the indicated HMA concentrations for 24 hrs, stained with DAPI and observed at the optical microscope. Fields in squares were magnified (lower panel). Scale bar 25 μm. (B) Electron microscope analysis was performed on ARPE-19 cells untreated (upper left panel) or treated with HMA (middle and right upper panels). In HMA-treated cells squares show vacuoles (middle upper panel). The left upper panel shows a high magnification image of an autophagosome (see the double membrane indicated by two red arrows) containing a mitochondrion. Blue arrow shows the double membrane of the mitochondrion. The green arrow indicates a mithocondrial creast. Bottom panel: Higher magnifications show the nucleus (N), endoplasmic reticulum (ER), autophagosomes (A). In (N), white arrow shows chromatin condensation, black arrow indicates the nuclear pore and arrow head the dilatation of the nuclear membrane. Scale bar: 0.5 μm.
