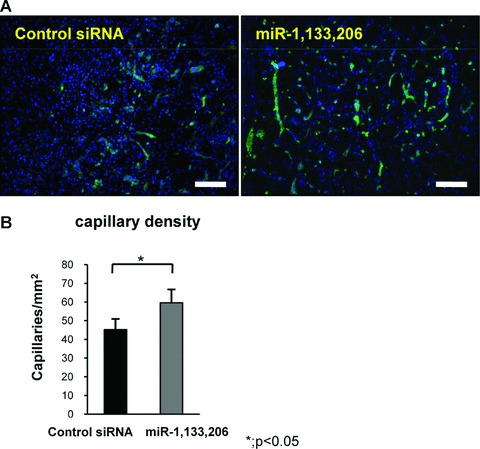
Fig 4.

Evaluation of angiogenesis. (A) Immunofluorescent analysis of isolectin B4 in the axial section of both groups. The bar indicates 100 μm. (B) Capillary density in both groups. The capillary density in the miRNAs group was higher compared to the control siRNA group. There was a significant difference between both groups. Data were calculated as means ± S.D. *; P < 0.05. The P-value was determined by the Mann-Whitney U-test.
