
Fig 5.
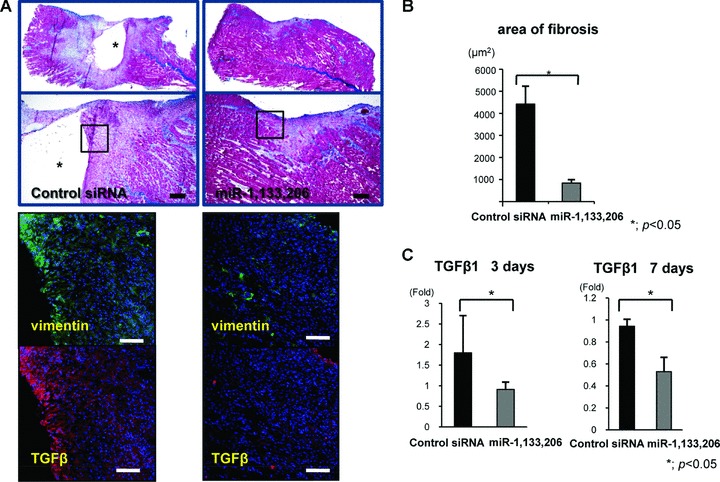
(A) Masson Trichrome staining in the sagittal section of each group (upper). * shows the defect at the laceration site. The bar indicates 300 μm. Immunofluorescent analysis of vimentin and TGF-β in the axial section of both groups (lower). These figures show the square part of the upper figures. The bar indicates 100 μm. (B) Area of fibrosis. The area in the miRNAs group was low compared to the control siRNA group. There was a significant difference between both groups. *; P < 0.05. (C) Real-time PCR analysis of TGF-β1 at days and 7 days after injury. The expression level of TGF-β1 was significantly down-regulated in the miRNAs group. Data were calculated as means ± S.D. *; P < 0.05. The P-value was determined by the Mann-Whitney U-test.