
Fig 2.
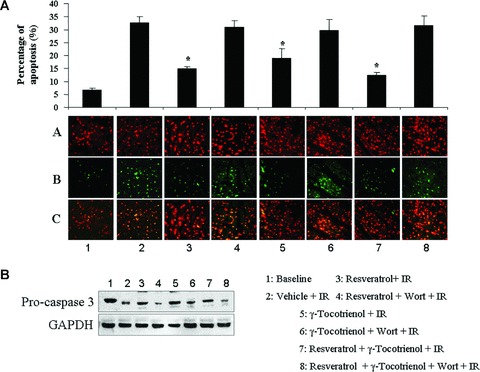
(A) Cardiomyocyte apoptosis was measured by TUNEL assay. Panel a shows the total no. of cells, panel b shows the apoptotic cells and panel c shows the merged pictures of panel a and panel b. Data were expressed as a ratio of apoptotic cardiomyocytes/total cardiomyocytes population. Values are expressed as mean ± S.E.M., n= 3 in each group. *P < 0.05. (B) Western blot analysis of caspase 3, GAPDH was used as loading control. Figures are representative images of three different groups, and each experiment was repeated at least three times.