
Fig 8.
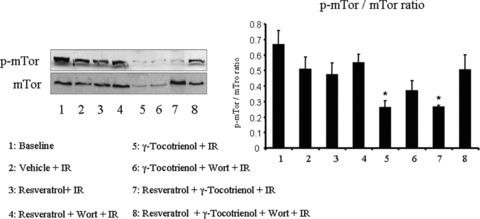
Western blot analysis of p-mTOR and mTOR. Figures are representative images of three different groups, and each experiment was repeated at least three times.
Official websites use .gov
A
.gov website belongs to an official
government organization in the United States.
Secure .gov websites use HTTPS
A lock (
) or https:// means you've safely
connected to the .gov website. Share sensitive
information only on official, secure websites.
Western blot analysis of p-mTOR and mTOR. Figures are representative images of three different groups, and each experiment was repeated at least three times.