Fig. 7.

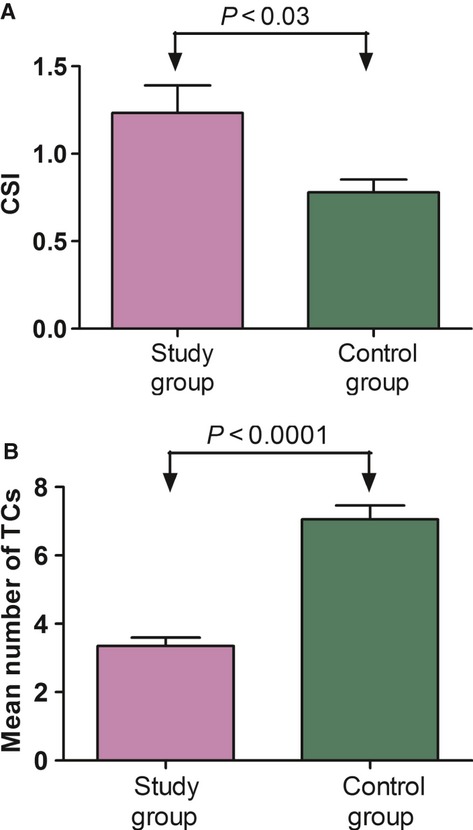
Cholesterol saturation index (CSI) (A – upper part) and the number of TCs (B – lower part) in patients with cholecystolithiasis (n = 24) and controls (n = 25). The data are expressed as the mean values ± SD.

Cholesterol saturation index (CSI) (A – upper part) and the number of TCs (B – lower part) in patients with cholecystolithiasis (n = 24) and controls (n = 25). The data are expressed as the mean values ± SD.