
Fig 2.
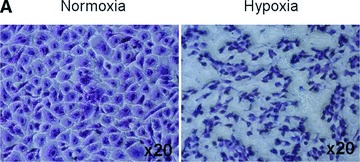
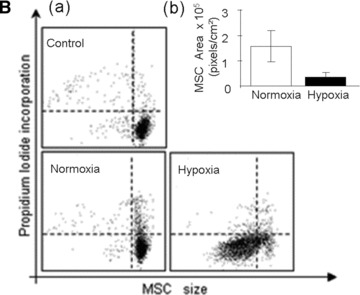
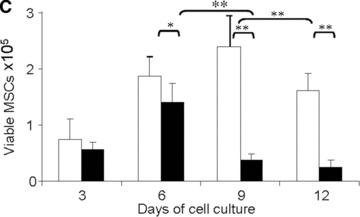
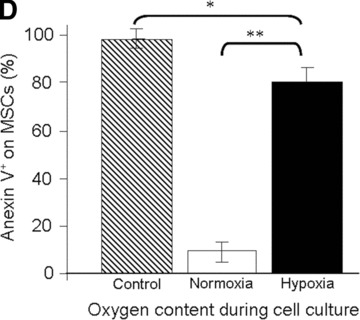
Viability of MSCs: in vitro model. (A) Morphology of MSCs either maintained in normoxia or exposed to hypoxia for 12 days. Stain: haematoxylin and eosin. Light microscopy magnification: ×20. (B) FACS analysis of cell size and area of MSCs either maintained in normoxia or exposed to hypoxia for 12 days. (C) Time course of cell viability when MSCs were either maintained in normoxia (white bars) or were exposed to hypoxia (black bars). (D) FACS analysis of apoptotic MSCs stained with annexin-V following either maintenance in normoxia (white bar); hypoxia (black bar) for 12 days or positive control in normoxia (striped bar). *P < 0.05 and **P < 0.001.