
Fig 4.
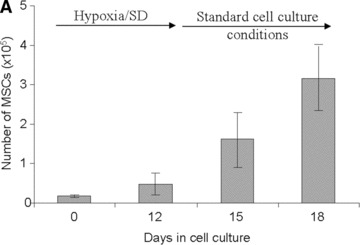
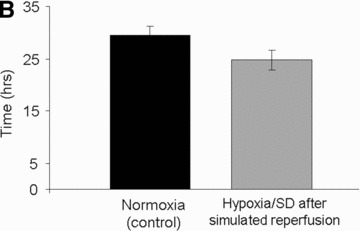

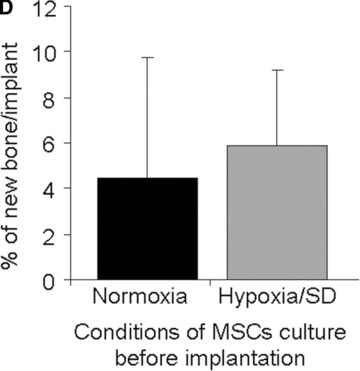
Assessment of MSC function. (A) Number of viable MSCs before and after simulated reperfusion in hypoxia/SD in vitro. (B) Doubling time of MSCs exposed to hypoxia/SD after simulated reperfusion (grey bar) compared to that of MSCs maintained under standard culture conditions (black bar) in vitro. (C) Representative histology results of MSC-containing constructs after 2 months of subcutaneous implantation in mice: (a) Transplanted implant without MSCs, (b) transplanted implant with MSCs cultured in normoxia and (c) transplanted implant with MSCs cultured in hypoxia/SD (including magnification of new formed bone also delineated by doted black lines for quantification), before implantation. Stain: Stevenel Blue and von Gieson picro-fuchsin (bone); (magnification: ×2). (d) Magnification (×20) of new formed bone with osteocytes and lacunae (arrows). (D) New bone quantification in MSC-containing constructs after 2 months of subcutaneous implantation in mice (normalized with respect to control scaffolds without MSCs).