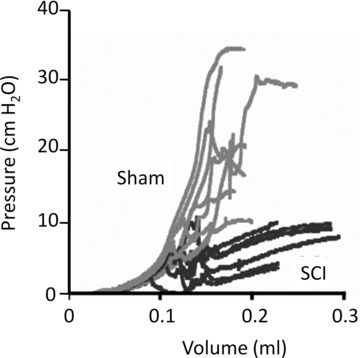
Fig 2.

Pressure–volume relationships. Pressure–volume curves of ex vivo bladders showing continuous pressure tracings as a function of filling volume. Data are from sham-operated controls (grey) and SCI animals (black). A reduction of slope indicates increased compliance.
