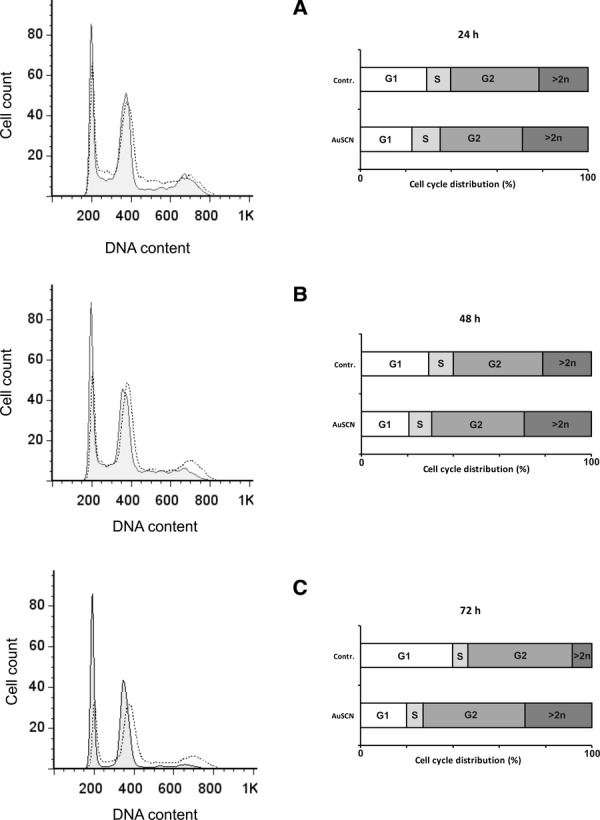
Cell cycle modulation by TrxR-inhibition. Cells were treated with 2.5 μM [Au(SCN)(PEt3)] for 24, 48 and 72 hrs and analysed with flow cytometry. The left graphs display DNA content of live cell populations as measured by PI-staining. Solid lines represent untreated control cells and superimposed dotted lines represent cells treated with TrxR-inhibitor. Left graphs show the cell cycle distribution in percentage of analysed cells. The distribution was modulated at all time points as compared to untreated controls with a larger fraction of cells displaying secondary cycling (n > 2), i.e. polyploidy with inhibition of TrxR.
