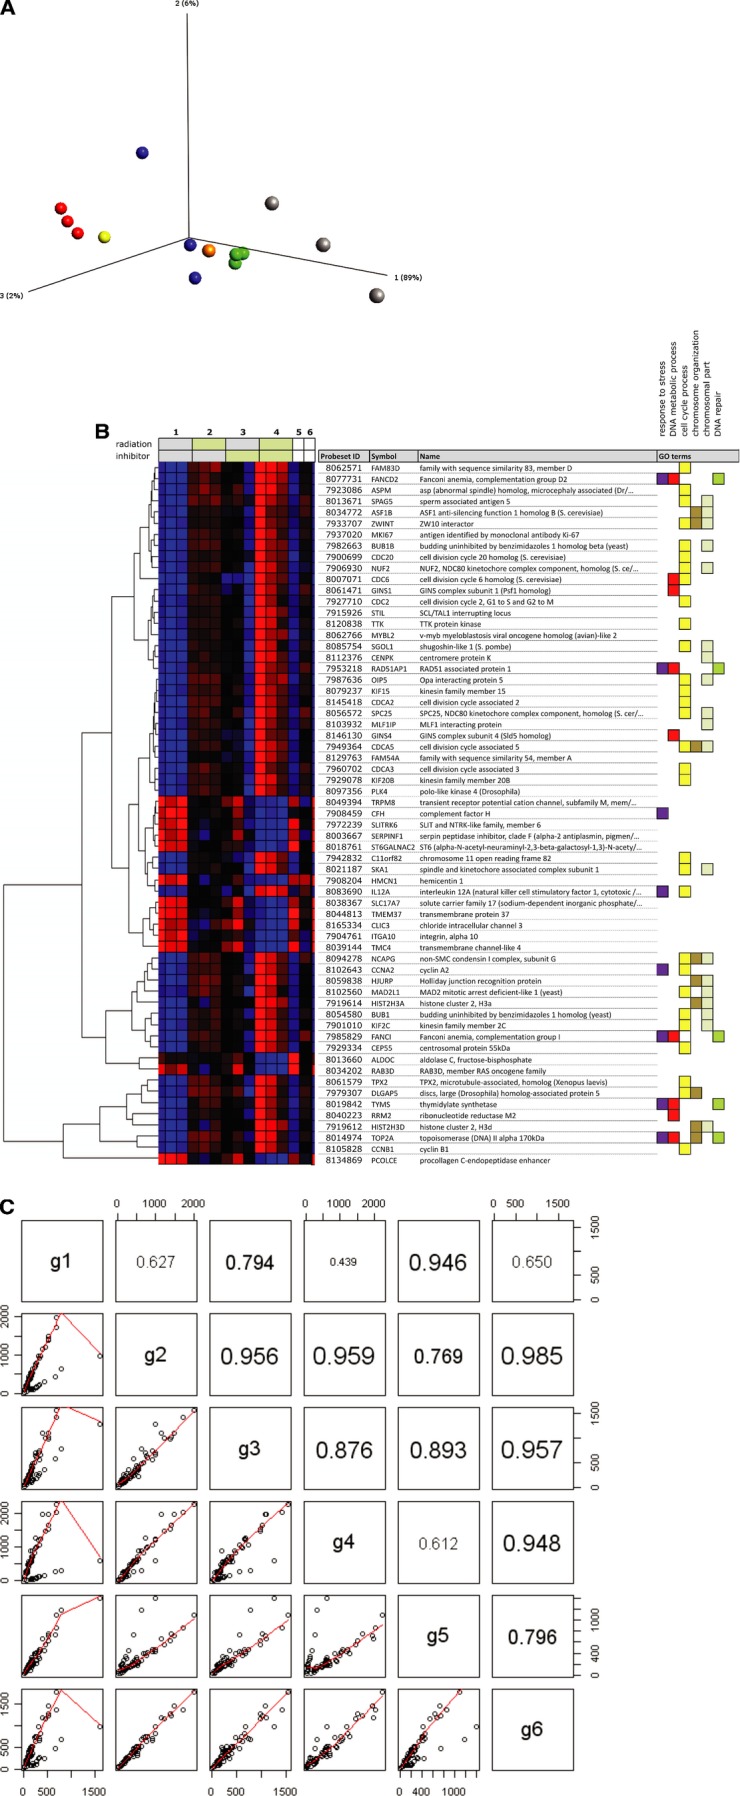
Gene expression analysis. (A) A three-dimensional principal component analysis (PCA) comparing the different treatment groups. Red spheres; control, green spheres; radiation, blue spheres; TrxR-inhibition by [Au(SCN)(PEt3)], grey spheres; combination treatment, orange sphere; TrxR-inhibition by siRNA, yellow sphere; scrambled siRNA sequence. Selection criteria; P≤ 0.0002 and FC ≥±2. Each treatment was performed in triplicates except a parallel control for TrxR-inhibition with siRNA (TrxR1 siRNA and a scrambled sequence, respectively). (B) Heatmap comparing expression patterns for all treatment variations. Selection criteria; P≤ 0.0002 and FC ≥±2. Horizontal rows represent individual genes and vertical columns represent individual samples. Each treatment was performed in triplicates except a parallel control for TrxR-inhibition with siRNA (the last two samples to the right, scrambled and TrxR siRNA, respectively). Coloured boxes to the right denote GO categories associated with the corresponding gene. (C) Pairwise scatterplots with correlation coefficients (Pearson correlation) for the average expression levels of different treatment groups. (g1 – untreated control, g2 – IR 5 Gy, g3 − 2.5 μM [Au(SCN)(PEt3)], g4 – IR+ inhibitor, g5 – Scrambled siRNA sequence and g6 – TrxR1 siRNA). Groups (g1–g6) correspond to numbered sets of vertical columns in (B).
