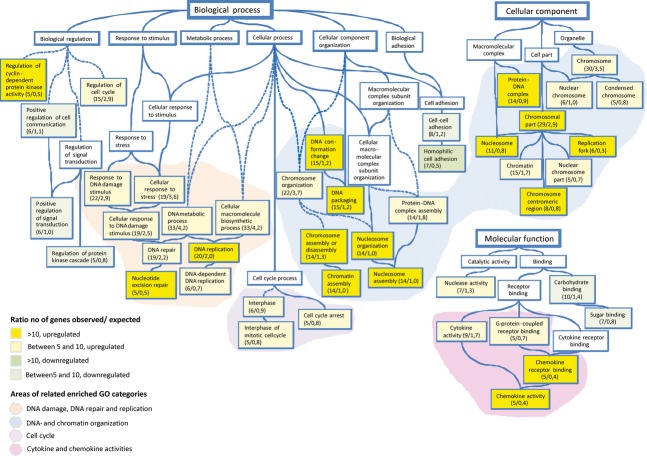
Graphical view of enriched GO categories. The GO categories having a statistical overrepresentation (i.e. enrichment) of differentially regulated genes in the treatment group of irradiation and inhibitor in combination have been brought together and visualized as a directed acyclic graph (DAG). A child node represents a more specific instance of a parent node, to which it is connected with a blue line (“is a” relationship). The numbers of observed/expected genes that were differentially regulated are indicated within each box representing an enriched GO-category. The colour of the boxes display the ratio between observed and expected up- or down-regulated genes. White boxes represent non-enriched GO categories that are included in the graph to allow tracing of the interrelationships between the GO categories. Striped lines represent connections where non-enriched GO categories have been omitted. Shaded areas represent related groups of GO categories.

An official website of the United States government
Here's how you know
Official websites use .gov
A
.gov website belongs to an official
government organization in the United States.
Secure .gov websites use HTTPS
A lock (
) or https:// means you've safely
connected to the .gov website. Share sensitive
information only on official, secure websites.
