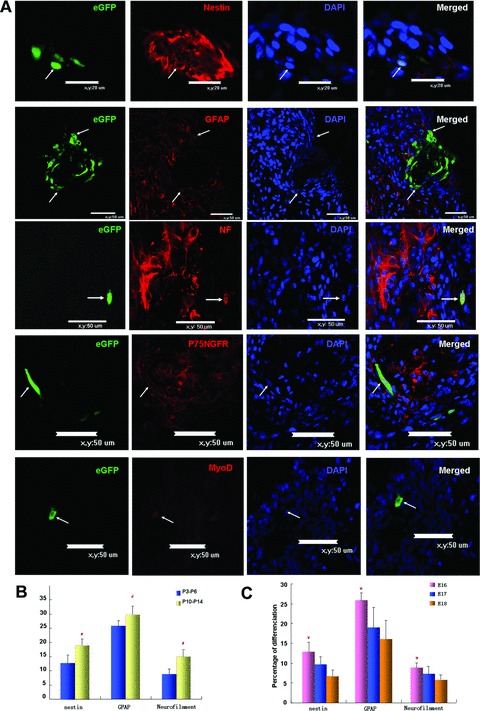
Fig 4.

Differentiation of transplanted MSCs in spinal column. (A) Confocal images showing colocalization of GFP and cell-specific markers (red) (arrows). Scale bar: 20 μm for nestin expression; scale bar: 50 μm in all the other panels: (B) Quantitative analysis of nestin, neurofilament and GFAP expressing MSCs in rat foetal spinal column with P3-P6 and P10-P14 cultured MSCs. (C) Quantitative analysis of nestin, neurofilament and GFAP expression in MSCs transplanted in E16, E17 and E18 spinal column. Percentages of transplanted MSCs expressing these markers were determined as the number of double positive cells/total GFP positive cells.#P < 0.05 compared with P3-P6 group. *P < 0.05 compared with E18 group.
