
Fig 5.
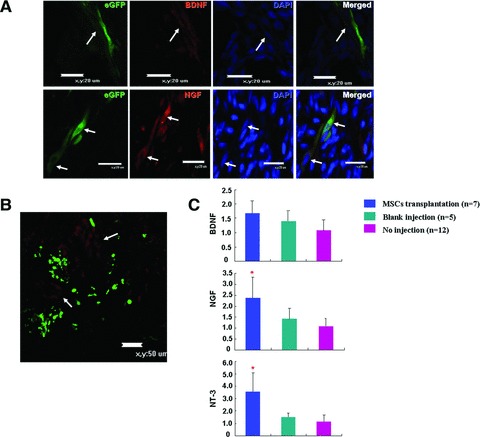
Neurotrophic factors induction by MSCs transplantation. (A) Confocal images showing transplanted MSCs expressed BDNF (red; upper) and NGF (red; lower) (arrows). Scale bar: 20 μm. (B) Confocal image showing NGF expression around the transplanted MSCs. Arrows indicated NGF positive cells (red) in the spinal tissue in adjacent to transplanted MSCs. Scale bar: 50 μm. (C) Real time analysis of neurotrophic factors expression in E20 spinal cords transplanted with MSCs (MSCs transplantation, n= 7), injected with same amount of medium (blank injection, n= 5) and without injection (no injection, n = 12). *P < 0.05 compared with blank injection.