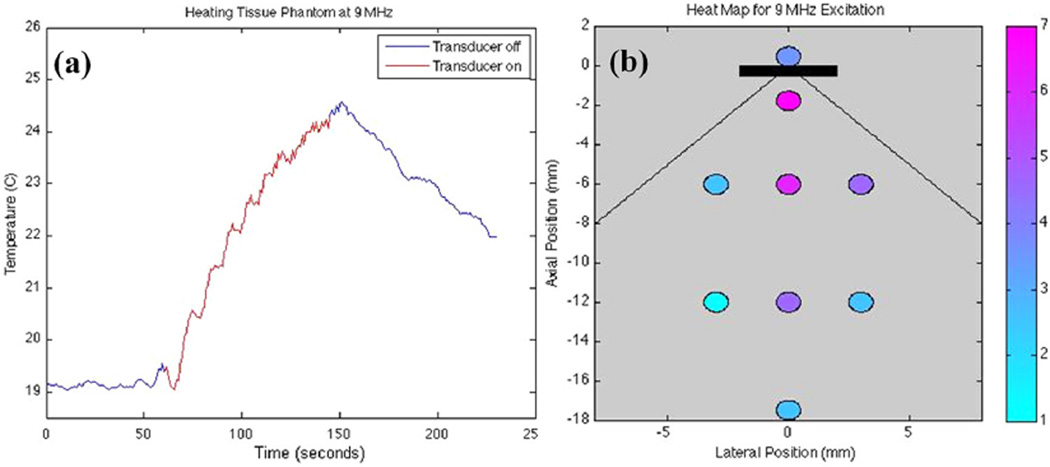
Figure 12.
(a) Thermocouple data for 60 seconds of heating at 9 MHz. ISPTP of 2.56 W/cm2 leads to a 5.5°C temperature rise. (b) Heating map in tissue phantom. Each data point corresponds to the maximum temperature rise after 90 seconds of 9-MHz excitation with ISPTP of 2.56 W/cm2. The black rectangle represents the transducer with the extended lines showing the ideal beam width of 90 degrees. Net forward electric power was 2.8 W.

