
6B.
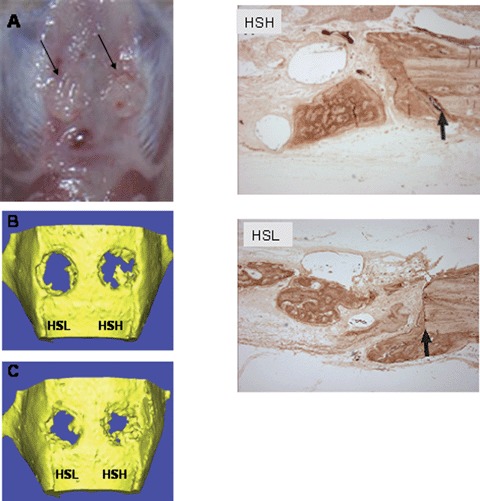
(A) Macroscopically observation of the defects sites shows excellent integration of the constructs with the host tissue (arrows). A smooth and non- fibrous integration could be observed for all groups at all time points. μCT scanning of the skull defect showing the progressive bone formation at 1 month (B) and 2 month (C) months with 5 microgram (HSL) and 30 microgram HS (HSH). Higher HS doses shows more bone formation in the defect site. (D) Antibody staining with a bone specific marker, namely osteocalcin (arrows show interface between host bone and newly formed bone) shows a stronger signal from the HSH group when compared to HSL group.