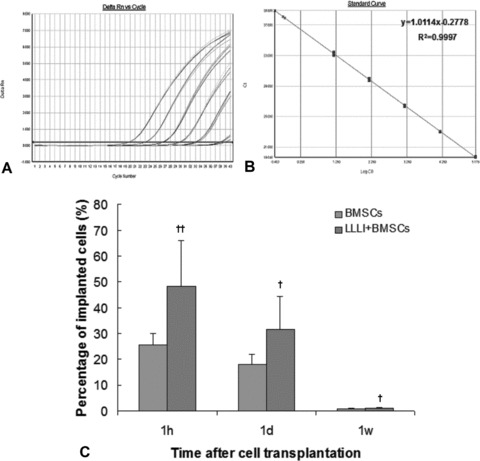
Fig 3.

Quantifying implanted male BMSCs in the female infarcted myocardium by real-time PCR. (A) Real-time amplification plot showing change in normalized reporter dye fluorescence (Rn) versus number of amplification cycles in sample containing serially diluted male BMSC genomic DNA. (B) Standard curve generated from data in (A) showing relationship between threshold cycle (Ct) and number of male BMSCs. (C) Time course of implanted BMSC survival (%). The percentage of cell survival in the infarcted myocardium was significantly higher in the LLLI + BMSC group than that in the BMSC group. Values were expressed as mean ± S.D. †P < 0.05, ††P < 0.01 versus BMSC group.
