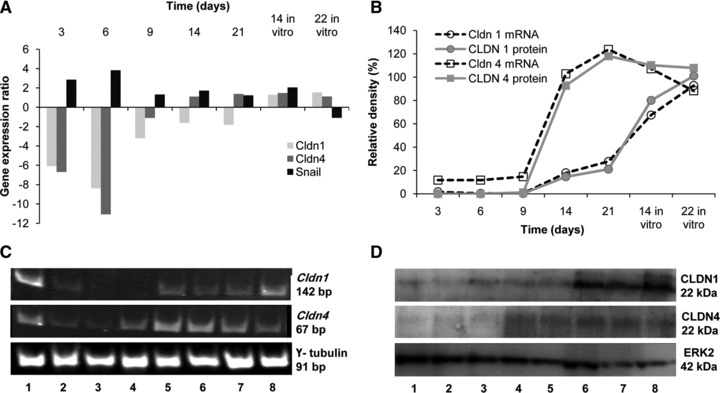
Fig 2.

Down-regulation of Cldn1 and Cldn4 in CC531 cells homing into the liver. (A) Expression profile of claudins (1, 4) and Snail in CC531 cells as shown by microarray analysis. The values represent the gene expression in isolated metastasizing cells in comparison to the expression in cells growing in vitro. (B) The diagram represents the mRNA or protein expression levels in re-isolated CC531 cells in percentage of the expression detected in control cells (100%). Values were calculated using the pixel density of each PCR/or Western blot band normalized to the corresponding value of γ-tubulin or ERK2, respectively. (C) Expression of claudins (1, 4) in CC531 cells as shown by RT-PCR. Lane 1: control CC531 cells, lanes 2–6: CC531 cells isolated from the liver after 3, 6, 9, 14 and 21 days, respectively, lanes 7, 8: CC531 cells re-isolated after 21 days and cultured in vitro for 14 and 22 days, respectively. (D) Expression of CLDNs (1, 4) in CC531 cells as shown by Western blot. Lanes 1–5: CC531 cells isolated from the liver after 3, 6, 9, 14 and 21 days, respectively, lanes 6, 7: CC531 cells isolated after 21 days and cultured in vitro for 14 and 22 days, respectively, lane 8: control CC531 cells.
