Fig 6.

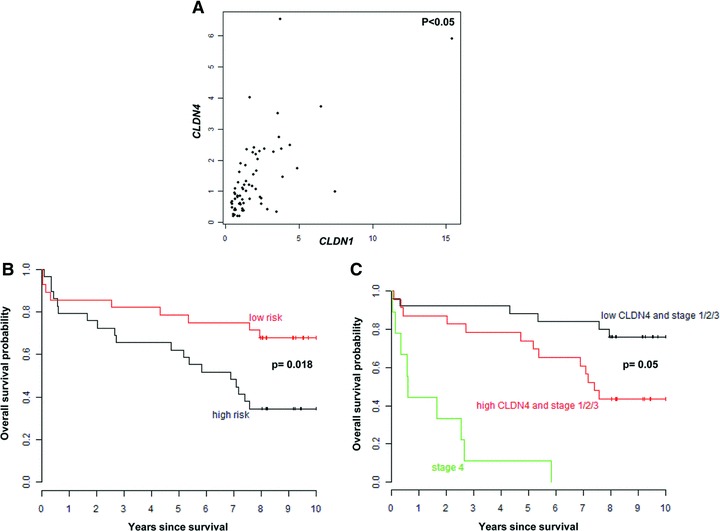
Correlation of CLDN1 or CLDN4 expression levels with prognosis in 67 CRC patients and with each other. (A) Scatterplot of the correlation between CLDN1 and CLDN4 expression levels assessed with the non-parametric correlation coefficient from Spearman. (B) The Kaplan–Meier plot represents the overall survival probability of CRC patients with high or low risk according to CLDN4 Median Split for overall survival. The log-rank test shows a significant difference (P= 0.018) between the two groups. (C) The Kaplan–Meier plot demonstrates the overall survival probability of CRC patients with high or low CLDN4 expression, dichotomized into high- and low-risk groups by the CLDN4 Median Split for overall survival and after separating the stages into I–III and IV stages. The Cox model shows a significant association between CLDN4 elevated levels and reduced overall survival (P= 0.05).
