Fig 3.

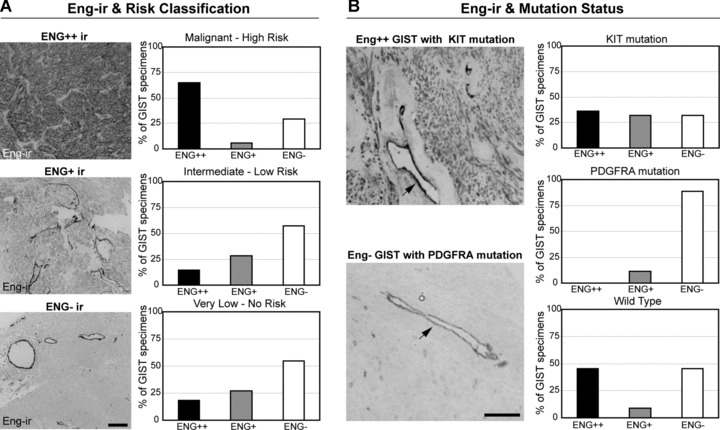
ENG-ir in human GIST tissue arrays. (A) First column: Representative examples of Eng-ir strongly positive, positive and negative (ENG++, ENG+, ENG−, respectively) GIST specimens. Scale bar: 20 μ microns. Second column: Percentage of ENG-ir specimens associated with different risk categories of human GIST. (B) First column: Representative example of ENG++ GIST specimen with KIT mutation (top) and an ENG− specimen with PDGFRA mutation (bottom). ENG-ir in vascular endothelium is indicated by arrow. Scale bar: 20 μm. Second column: Percentage of ENG-ir specimens according to their KIT and PDGFRA mutation status.
