
Fig 2.
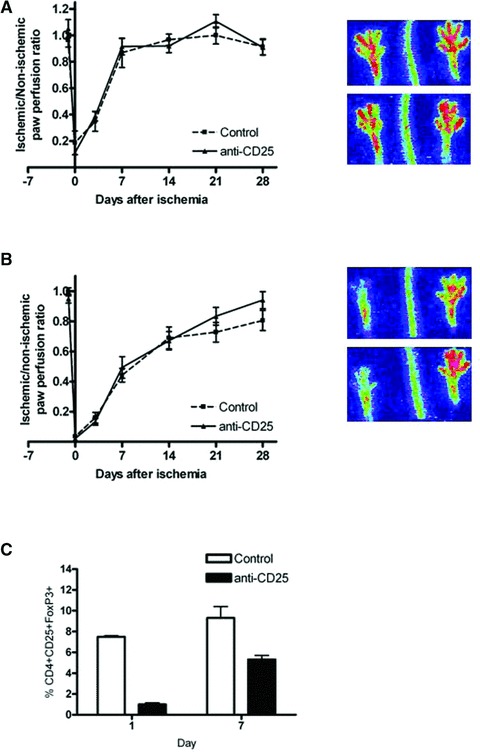
(A) The LDPI graph depicts the mean ± S.E.M. of blood flow recovery after single electro-coagulation of the femoral artery in hind limb of C57Bl6 mice injected with isotype control (n= 10) or anti-CD25 antibody (n= 10). Blood flow was expressed as ratio between the operated and non-operated limb measured before and directly after surgery and at days 3, 7, 14, 21 and 28. Images on the right depict representative LDPI images of paws of mice injected with isotype control (upper) or anti-CD25 antibody (lower) 7 days after induction of hind limb ischemia. (B) The LDPI graph depicts the mean ± S.E.M. of blood flow recovery after double electro-coagulation of the femoral artery and iliac artery in hind limb of C57Bl6 mice injected with isotype control (n= 10) or anti-CD25 antibody (n= 10). Blood flow was expressed as ratio between the operated and non-operated limb measured before and directly after surgery and at days 3, 7, 14, 21 and 28. Images on the right depict representative LDPI images of paws of mice injected with isotype control (upper) or anti-CD25 antibody (lower) 7 days after induction of hind limb ischemia. (C) Quantitative flow cytometry analysis of the percentage of CD4+CD25+FoxP3+ regulatory T cells among CD4+ cells in blood of C57Bl6 mice treated with isotype control or anti-CD25 antibody 24 hrs and 7 days after hind limb ischemia induction.