3.

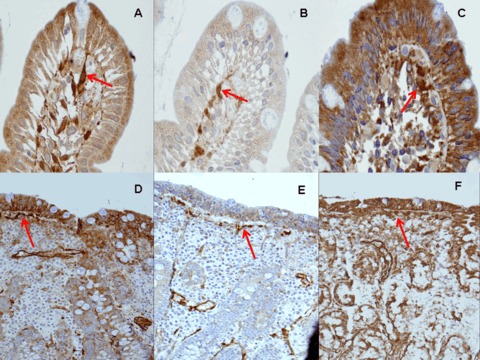
The arrows show the staining patterns of the three new mAbs in paraffin fixed sections. The figures above show initial lesions, the figures below show atrophic lesions. (A) and (D) mAb 1, (B) and (E) mAb 2, (C) and (F) mAb 3 (original magnification ×100).
