
3.
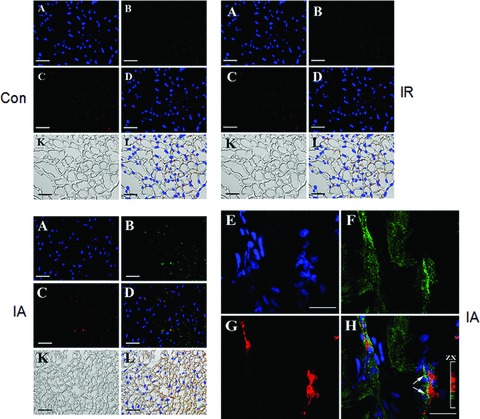
Colocalization of BAG-1 and LC3. Immunofluorescence imaging of the expression of BAG-1 (B) and LC3 (C) in tissue sections obtained from hearts subjected to ischaemia and reperfusion (I/R), ischaemic adaptation followed by ischaemia and reperfusion (IA), and from control (Con) rats. (A), (E) – counterstaining of nuclei with Hoechst 33342 (blue channel); (B), (F) – immunofluorescence staining of BAG-1 (Alexa 488, green channel); (C), (G) – immunofluorescence staining of LC3-II (Alexa 594, red channel); (D), (H) – overlay of blue, green and red channels; (K) – Nomarski interference contrast images of the specimens; L – overlay of images presented in the (D) and (K). Confocal images showing the colocalization of BAG-1 and LC3 in IA heart samples (E-H). Bars in the images (A), (B), (C), (D), (K) and (L) are representing 100 μm. Bars in the images (E)–(H) are representing 10 μm.