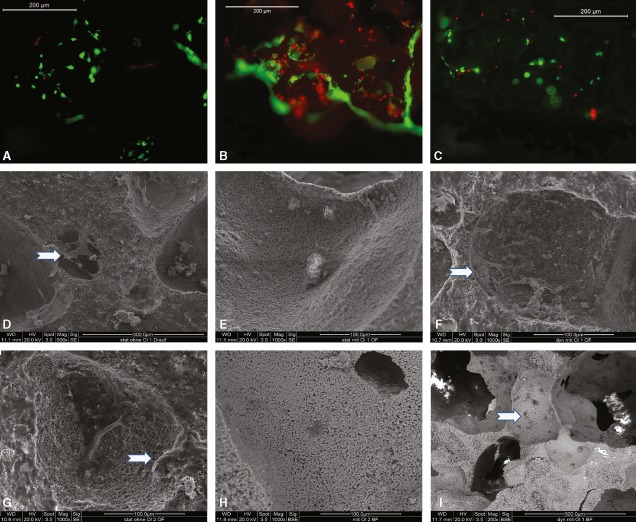
Fig 3.
In vitro analysis of osteoblast-loaded constructs (group 1). (A–C) Fluorescent microscopic observation of live cells (green) and dead cells (red) (A) Group 1A, (B) Group 1B, (C) Group 1C. (D–I) Scanning electron microscopic images of the constructs: (D–F) Week 3, (G–I) Week 6. (D,G) Group 1A, (E,H) Group 1B, (F,I) Group 1C. Please note the different scale bars. The scaffold interiors are examined in (H, I). Arrows indicate the cells. Details are described in the text.

