
Fig 5.
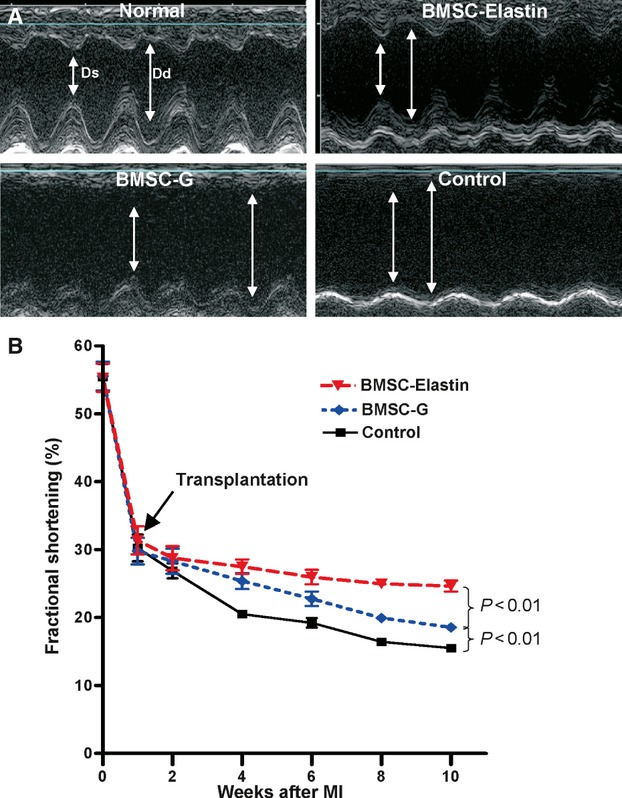
Echocardiographic analysis of cardiac function. (A) Echocardiographic M-mode traces of rat hearts before MI (normal) and 10 weeks after MI. Ds = end-systolic dimension, Dd = end-diastolic dimension. (B) Prior to and 1 week after MI, there was no difference in fractional shortening among groups (n = 8 per group). However, 10 weeks post-MI, the BMSC-G group showed significant preservation of fractional shortening compared with the control group, whereas the BMSC-elastin group showed significantly greater fractional shortening compared with either the medium control or BMSC-G group.