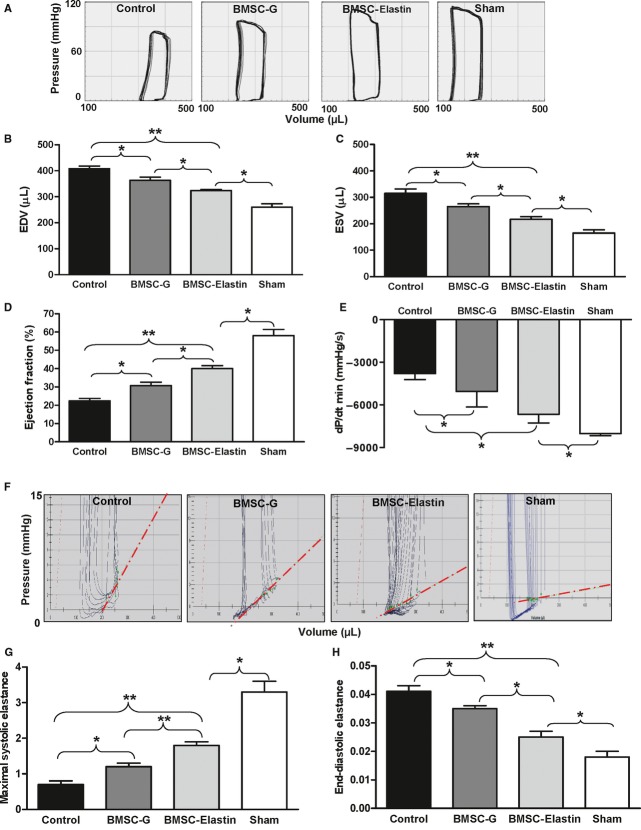
Fig 6.
Pressure–volume analysis of cardiac function. (A) Representative P–V loops of rat hearts 9 weeks after cell transplantation. A sham non-ligated control depicts normal cardiac function. The BMSC-G and BMSC-elastin groups had smaller ventricular volumes than the medium control group. (B, C) The BMSC-elastin group had significantly smaller end-diastolic volume (EDV) and end-systolic volume (ESV) than the BMSC-G group (n = 4 per group). (D, E) The load-dependent index of systolic function (ejection fraction) was significantly greater in the BMSC-elastin group than the BMSC-G group, which was better than the medium control group. Diastolic function (dP/dtmin) was significantly better in the BMSC-elastin group versus the other two groups (n = 5 per group). (F) Representative P–V loops during vena cava occlusion demonstrate diastolic function and the position and slope of the end-diastolic pressure–volume relationship (EDPVR, red dotted line). (G, H) The load-independent indices of both systolic and diastolic function (maximal systolic elastance and end-diastolic elastance) were significantly improved in the BMSC-elastin group compared with the BMSC-G group, which was better than the medium control group (n = 4 per group). Elastin overexpression resulted in a more compliant left ventricle. (*P < 0.05, **P < 0.01).

