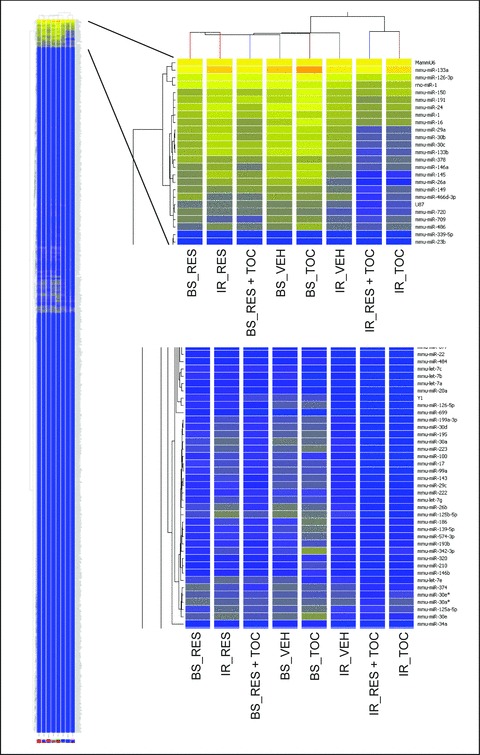
Fig 1.

Global miRNA expression and hierarchical clustering of sham vehicle (BS) or ischaemia-reperfused (IR) hearts pretreated with resveratrol (RES), tocotrienol (TOC) and resveratrol and tocotrienol (RES + TOC) using Taqman Microfluidics Array card. A partial heat map depicts the distinct patterns of miRNA expression in the samples. Vertical columns and horizontal rows represent samples and miRNAs, respectively. The red or yellow colour represents a relatively high or low expression, respectively. An overall expression pattern of 588 miRNAs is shown by a compressed heat map (left).
