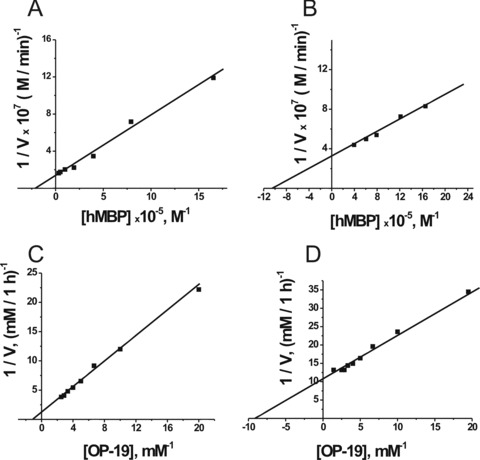
Fig 6.

Determination of the Km and Vmax values for hMBP (A and B) and OP-19 (C and D) using a Lineweaver–Burk plot. The reactions were performed as described in Materials and Methods using 5 mg/ml (A and B) and 16 mg/ml pIgGs (C and D) of IgG fractions after chromatography on hMBP-Sepharose: fraction 1 (A and C) and fraction 9 (B and D). The average error in the initial rate determination at each substrate concentration from two independent experiments did not exceed 7–10%.
