
5.
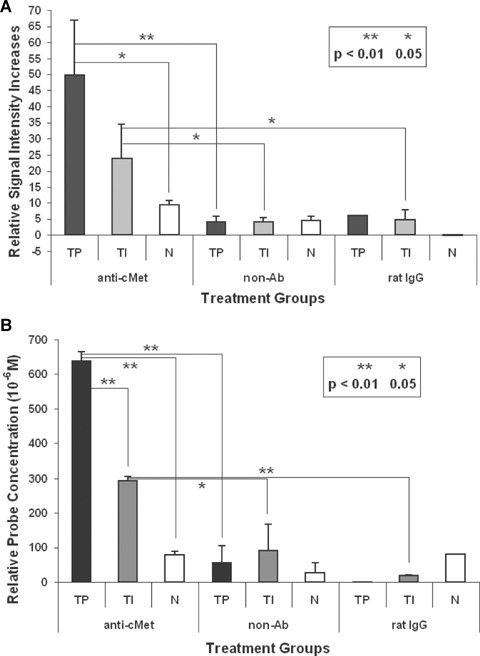
Relative differences in regional (A) MR signal intensities and (B) relative probe concentrations (differences in relaxation rates [1/T1][10−6 M]), as outlined in each T1-weighted image in Figure 4, following pre-and post-administration after 3 hrs, of the anti-c-Met molecular targeting agent (anti-c-Met) (region-of-interests [ROIs] shown in T1w c-Met images; in rat C6 gliomas at 23, and 17 days, respectively); pre- and post-administration, after 3 hrs, of non-Ab Gd-DTPA-BSA (non-Ab) in C6 gliomas at 21 days (from ROIs depicted in T1w no Ab images), and pre- and post-administration, after 3 hrs, of normal rat IgG-Gd-DTPA-BSA (rat IgG) in a C6 glioma at 21 days (from ROIs shown in T1w IgG images). Mean ± S. D. values for normal brain (N), tumour interior (TI) and tumour periphery (TP) are displayed in histograms. Significant differences were obtained if P-values were (*) <0.05, or (**) <0.01, between groups highlighted. For the normal rat IgG probe the number of regions sampled for TP and N was n = 1, that is no statistical data was obtained.