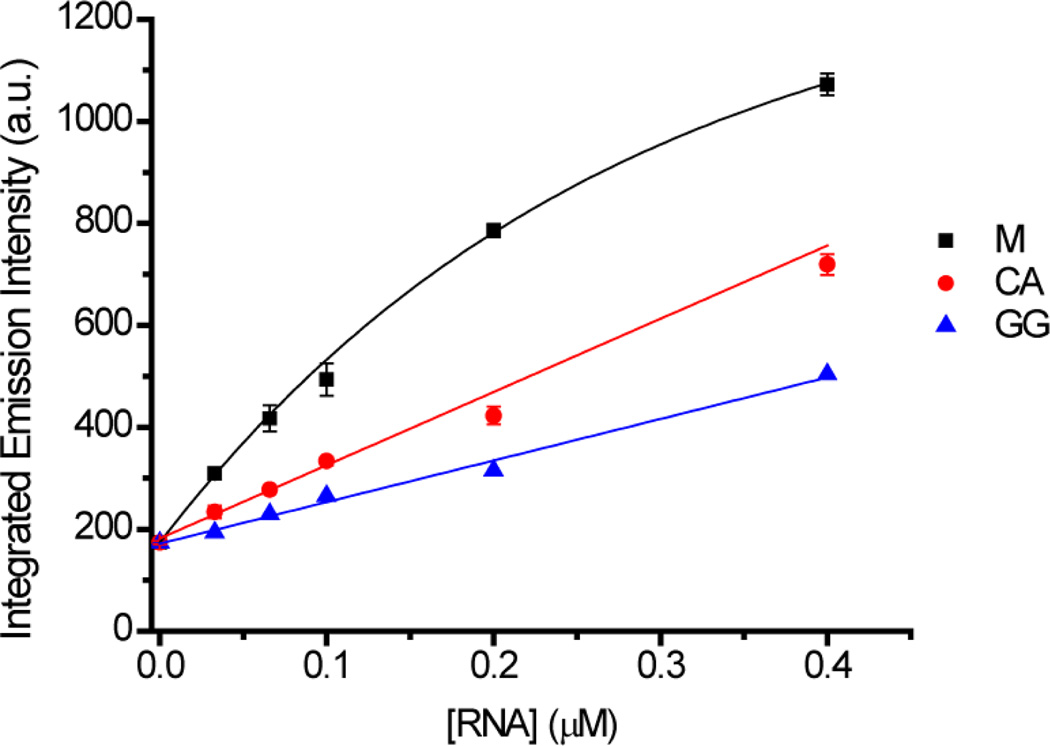
Figure 3.
Plots of integrated emission intensities (λex 512 nm) of ethidium bromide (0.1 µM) in the presence of increasing concentrations of RNA hairpins containing mismatches (0–0.4 µM) in 5 mM Tris, pH 7.5, 50 mM NaCl. Hairpins: M (black), CA (red), GG (blue). Error bars indicate standard deviations in the measurements calculated for three replicates.

