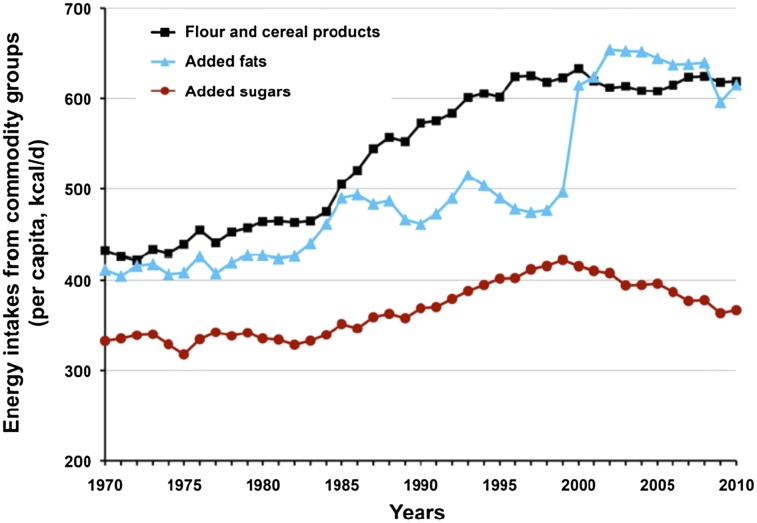
FIGURE 1.
Energy intakes from commodity groups, 1970–2010, demonstrating that added sugars comprise a small portion of increased caloric consumption and have been in decline since 1998. Reproduced from (2) with permission. From: USDA Economic Research Service Average Daily per Capita Energy from the US Food Availability, adjusted for loss.

