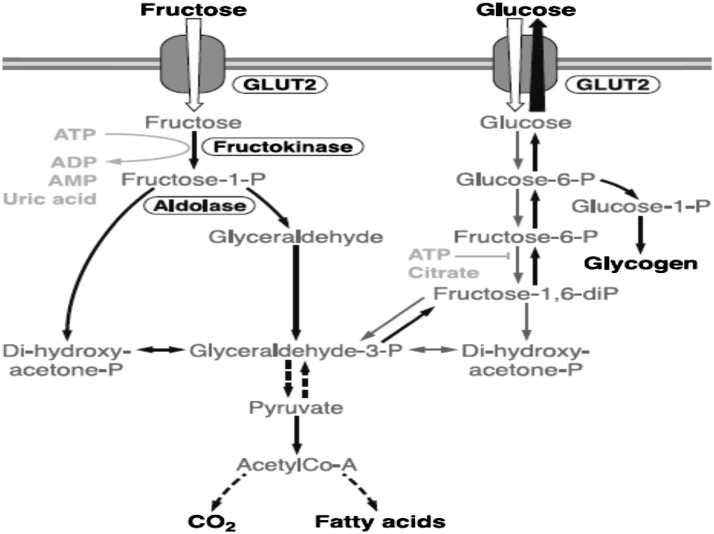
FIGURE 4 .
Metabolism of fructose and glucose in the liver. Although there are differences in metabolism, the pathways are interactive, as indicated in the figure. Reproduced from (22) with permission. ADP, adenosine diphosphate; AMP, adenosine monophosphate; ATP, adenosine-5'-triphosphate; CO2, carbon dioxide; GLUT, glucose transporters.

