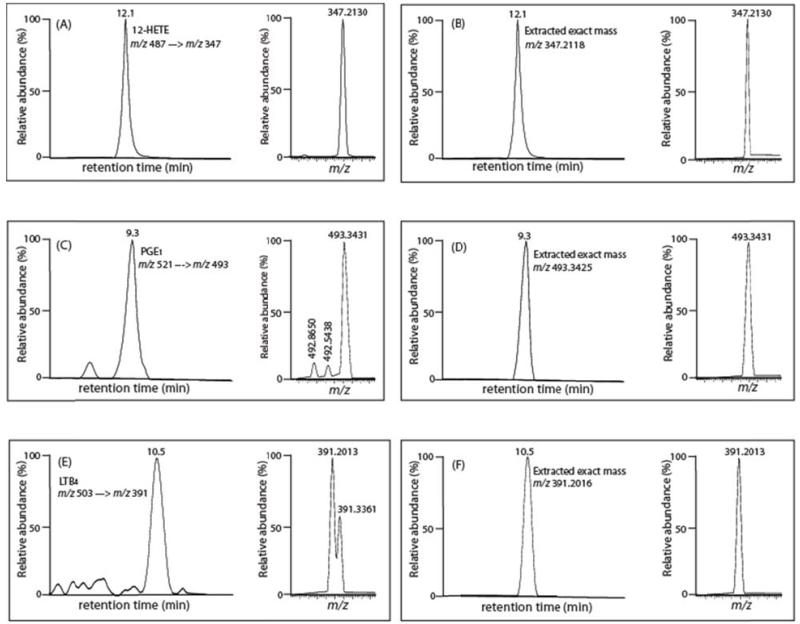
Figure 4. Comparison of quantitative methods for measuring selected eicosanoids in mouse serum using mass unit resolution of product ion SRM and accurate mass product ion SRM.
(A) Peak retention time profile and SRM transition (m/z 487 → m/z 347) of 12-HETE-AMPP with mass unit resolution; (B) Peak retention time profile and high mass accuracy extracted ion chromatogram of the product ion at m/z 347.2188 (within 5 ppm); (C): Peak retention time profile and SRM transition (m/z 521 → m/z 493) of PGE1-AMPP with mass unit resolution; (D) Peak retention time profile and high mass accuracy extracted ion chromatogram of the product ion at m/z 493.3425 (within 5 ppm); (E) Peak retention time profile and SRM transition (m/z 503 → m/z 391) of LTB4-AMPP with mass unit resolution; (F) Peak retention time profile and high mass accuracy extracted ion chromatogram of the product ion at m/z 391.2016 (within 5 ppm).

