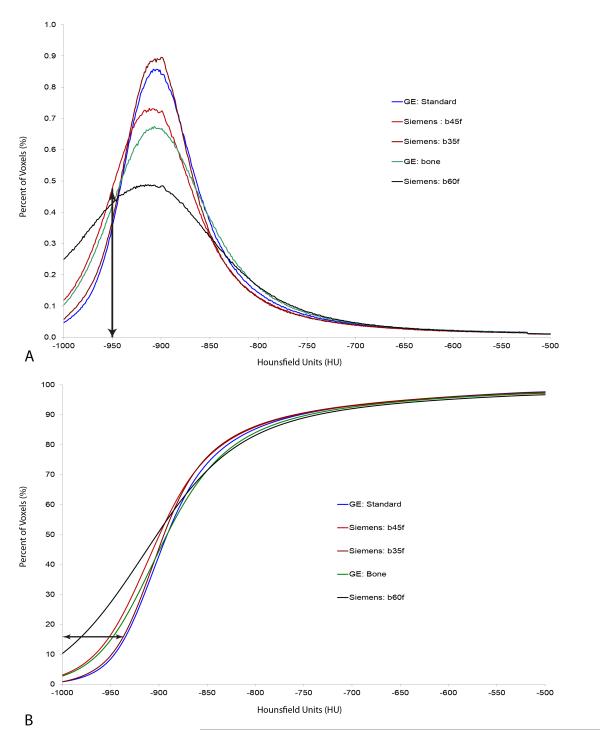
Figure 1.
This figure shows some representative frequency distribution curves (A) and cumulative distribution curves (B) for five different reconstruction algorithms from two CT manufacturers from a single subject (the GE scans were acquired 9 months before the Siemens scans). The vertical arrow in panel A shows the -950 HU threshold cut-off for low attenuation analysis of emphysema. The horizontal arrow in panel B shows the 15th percentile cut-off analysis for emphysema. Both of these panels show that the reconstruction algorithm can make significant differences in the “extent of emphysema” measured.

