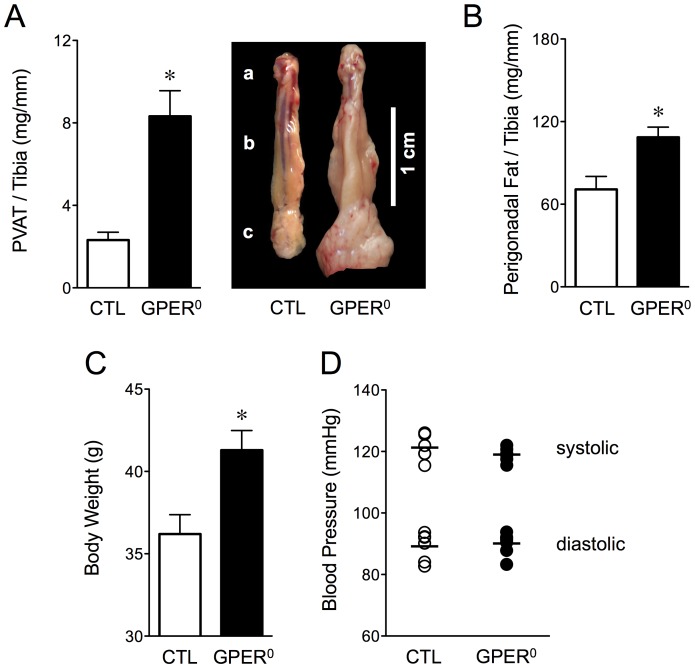
Figure 1. Perivascular adipose and perigonadal fat mass, body weight and blood pressure in monogenic obesity (GPER0).
A, Mass and macroscopic difference in the quantity of perivascular adipose (PVAT) surrounding the aorta (a, Aortic arch; b, Thoracic aorta; c, Abdominal aorta) of obese (GPER0, n = 5) and lean WT control mice (CTL, n = 8). B, Perigonadal fat weight (CTL, n = 8; GPER0, n = 9); C, body weight (n = 19/group); D, systolic and diastolic blood pressure levels in obese (GPER0,  , n = 7) and lean WT mice (CTL,
  , n = 6). Fat weights are normalized to tibial length. A–C: open bars, lean WT control (CTL); solid bars, monogenic obesity (GPER0). *p<0.01 vs. control.

