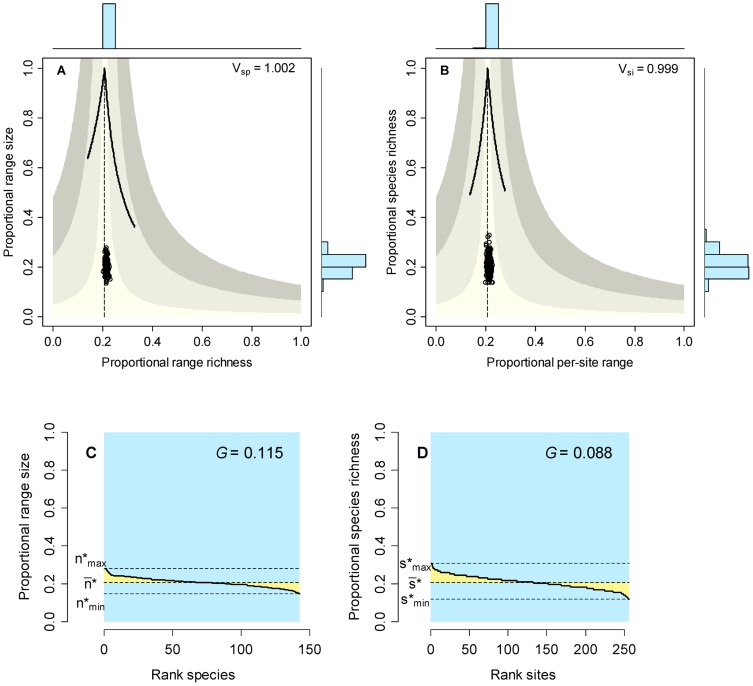
Figure 2. Initial conditions of the neutral models described in the text.
Range diversity plots by species (A) and by sites (B) show the values of Schluter's variance ratio index. Vertical dashed lines correspond to the value of  ; solid curves show maximum possible values in richness and range size, and shaded areas show the average covariance of species and of sites (from the vertical line outward, limits are covariance +/−0.01, 0.05, 0.1. Rank plots depict the range-size (C) and species richness (B) frequency distributions and the value of Pearson's measure of skewness; colors as in Figure 1.

