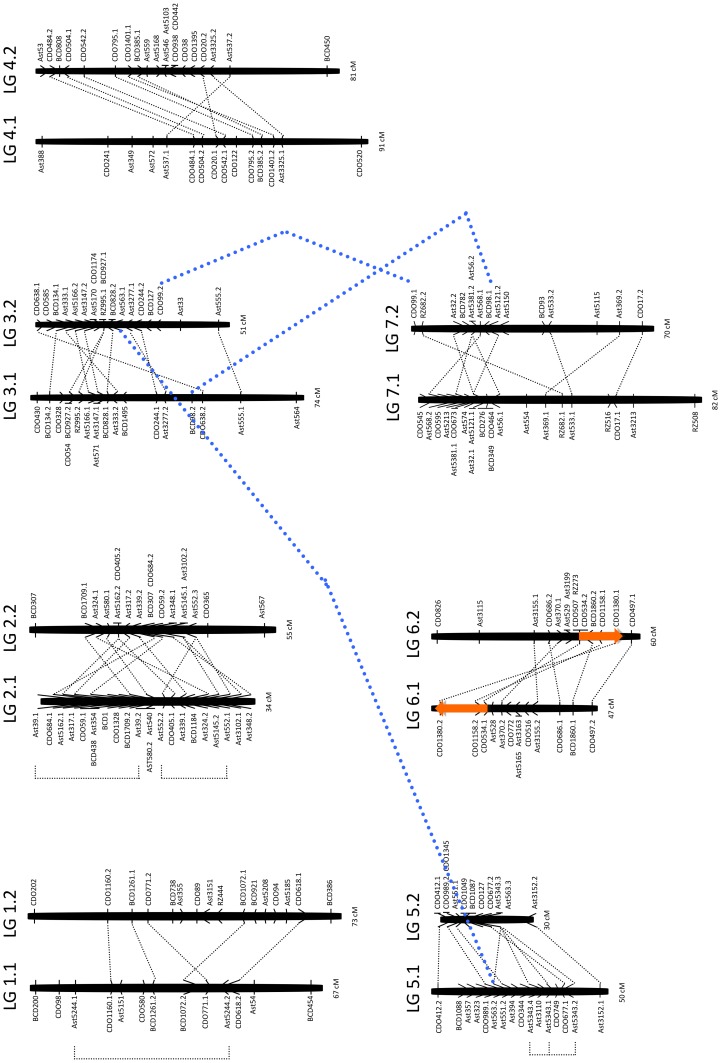
Figure 1. EST-RFLP genetic linkage map of creeping bentgrass.
Two different creeping bentgrass diploid genomes are indicated by seven pairs of the homoeologous linkage groups (LGs) followed by “.1” or “.2”. The total map length in cM is shown on the bottom of each LG. The creeping bentgrass, barley, oat and rice cDNA probes used as RFLP markers are indicated as Ast, BCD, CDO and RZ, respectively followed by the probe number. The probe numbers plus ‘.1’, ‘.2’, ‘.3’ or ‘.4’ show duplicate loci detected by the same hybridization probe, which are connected by a dashed black line. Loci connected by a dashed bold blue line are detected between different LGs by the same hybridization probe. The segment on LGs 6.1 and 6.2, spanning three RFLP markers (CDO1380, CDO1158 and CDO534) superimposed by an orange arrow indicates an inversion and translocation between the two homoeologous LGs.

