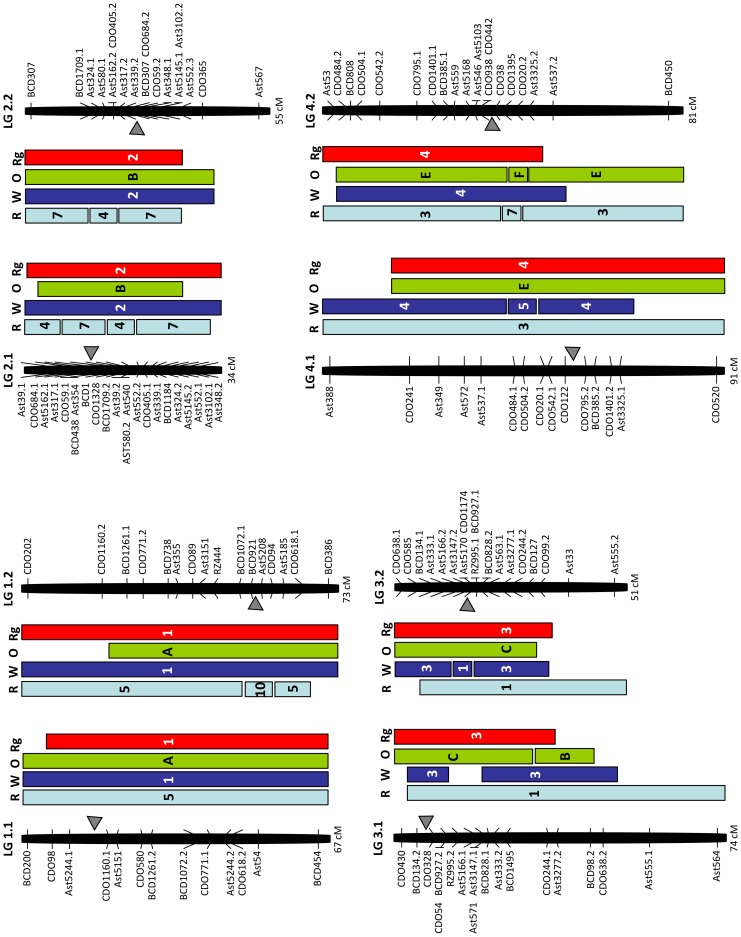
Figure 2. Comparative genome relationships on creeping bentgrass linkage groups 1–4 relative to rice, the Triticeae, oat, and ryegrass.
Comparative genome relationships between creeping bentgrass genetic linkage map and the genetic maps of rice (R), the Triticeae (W), oat (O), and ryegrass (Rg), respectively, represented by a colored box. The markers shown on the right or left side of each linkage group correspond to those mapped in the creeping bentgrass linkage map shown in Figure 1. The number or letter inside the color boxes represents the segments of chromosomes or linkage groups from each of the genomes (R, W, O, Rg) that are syntenic to the bentgrass linkage groups. The arrowheads indicate the deduced location of the centromere in bentgrass from the comparisons with Triticeae chromosomes. The total map distances (cM) are shown on the bottom of each linkage group.

