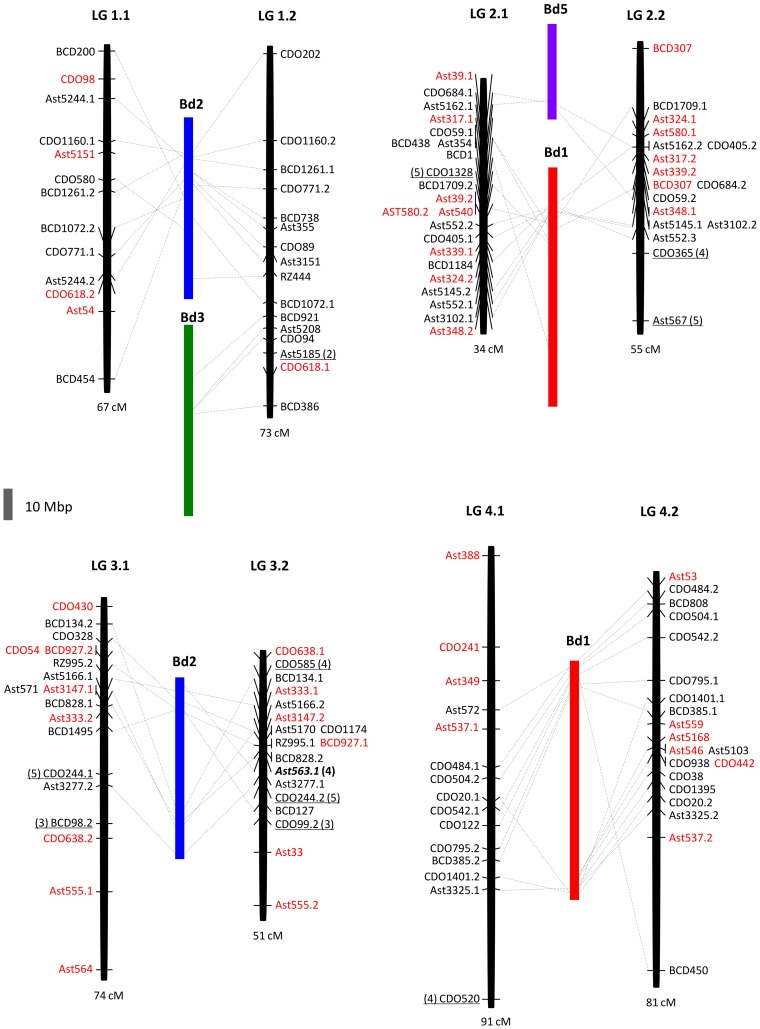
Figure 4. Comparative genome relationship on creeping bentgrass linkage groups 1–4 relative to Brachypodium distachyon.
Comparative genome relationship between creeping bentgrass genetic linkage map and chromosomes of B. distachyon by determining the chromosomal location of sequences of the EST-RFLP markers mapped on the creeping bentgrass linkage map. The black bar represents each of the bentgrass linkage groups (total length in cM, below the bar) as shown in Figure 1. The colored bars represent each of B. distachyon chromosomes (Bd). The collinearity is represented by a dashed black line that links the RFLP markers with the highly similar sequences located in B. distachyon chromosomes. Markers in red have no significant sequences similarity with B. distachyon genome. Underlined markers have significant sequences similarity with B. distachyon chromosomes indicated in parenthesis. Markers in bold and italics are duplicated between B. distachyon chromosomes indicated in parenthesis. The grey scale bar on the left bottom of the Figure is 10 Mbp of B. distachyon genome.

