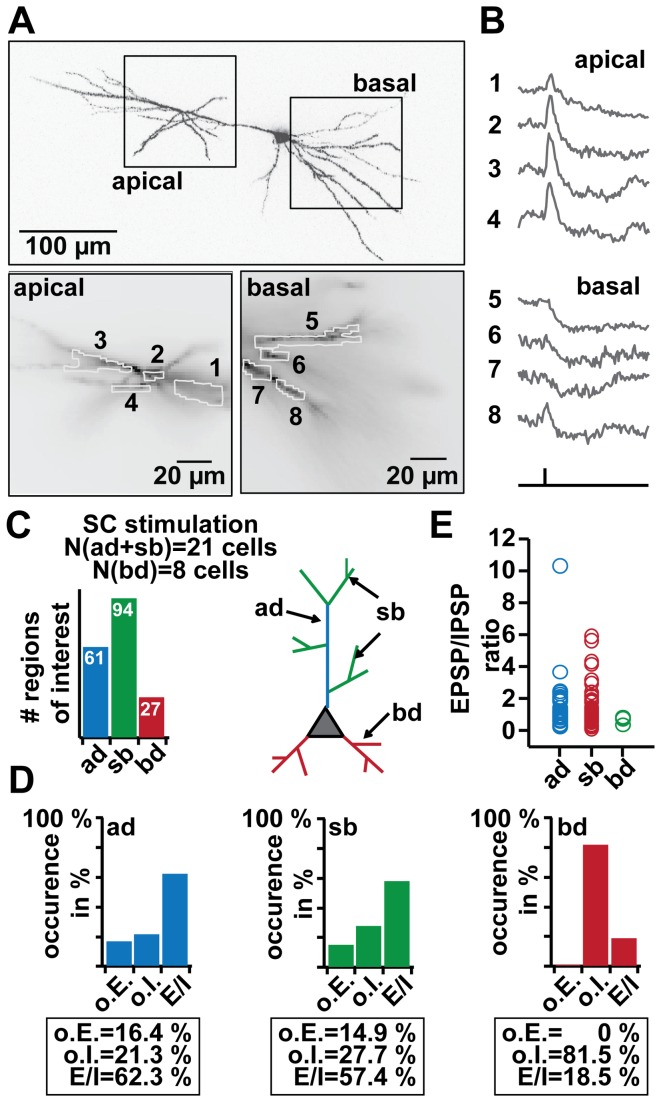
Figure 3. EPSP-IPSP patterns in distinct dendritic branches.
A. Top: two-photon reconstruction of imaged cell. Rectangles show recording site at the apical and basal dendrite. Bottom: ROI in apical (1-4, left) and basal (5-8, right) dendrites. Sum of averaged pixels per region ~20-50. B. Optical recordings of EPSP-IPSP patterns in apical (ROI 1-4) and basal (ROI 5-8) dendrites evoked by SC stimulation. ROI as in A (recordings were averages of 4-10 trials). See also supportive Movie S2. C. Classification of measured dendritic subcompartments (20-50 pixels) in SC experiments. ap = apical dendrite (blue), sb = side branch (green), bd = basal dendrites (red). Total of cells N = 21 (thereof eight also for experiments in the basal dendrites). Left: plot of total analysed ROIs; Right: schematic illustration of CA1 pyramidal cell, colour code shows subdivision of the dendrites in ap, sb and bd. D. Frequency of occurrence plots for only EPSPs (o.E.), only IPSPs (o.I.) or EPSP-IPSP (E/I) sequences in ad, sb or bd ROIs. 100 % represents the total amount of regions measured for ad, sb or bd. E. Distribution of relative amplitudes for EPSP-IPSP sequences in ap, sb and bd.

