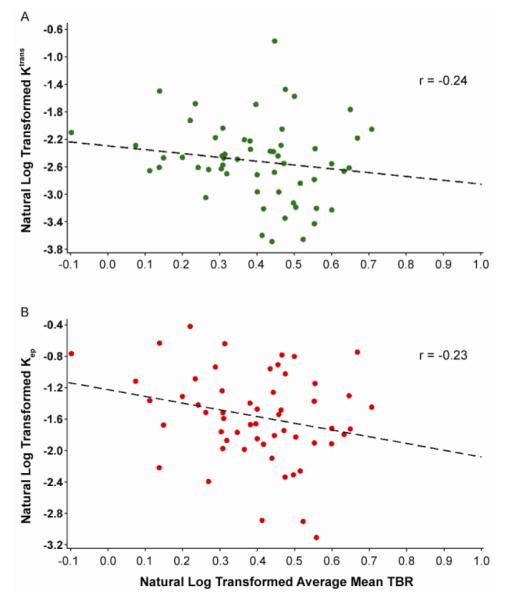
FIGURE 2.
Correlation between DCE-MRI and mean TBR by PET/CT, in the carotid arteries of subjects with CHD or CHD risk equivalent. (A) Correlation between Ktrans by DCE-MRI and mean TBR by PET/CT. (B) Correlation between Kep by DCE-MRI and mean TBR by PET/CT. x axis, mean TBR; y axis, DCE-MRI variables. Black dotted line, regression line. Ktrans = wash-in constant from plasma to tissue constant; Kep = wash-out constant from tissue to plasma; TBR = target-to-background ratio.

