
Figure 4. Quantitative differences in twitching.
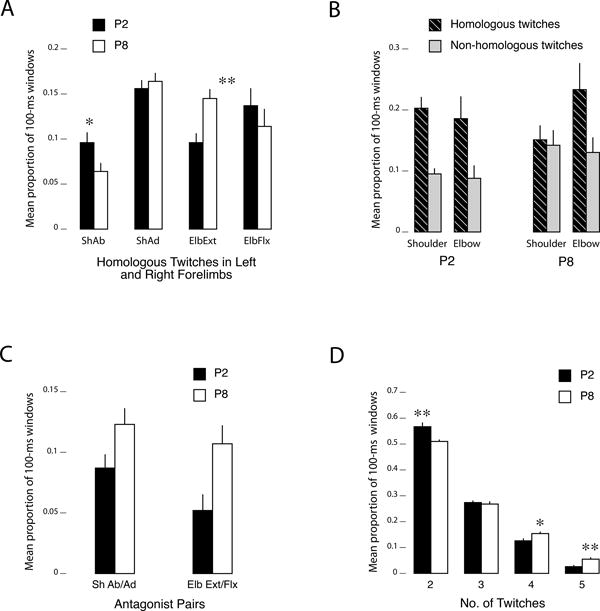
(A) Mean proportion of 100-ms windows (per pup/litter) containing antagonist twitch movements at the shoulder (adduction and abduction) and elbow (flexion and extension) at P2 (black bars) and P8 (white bars). (B) Mean proportion of 100-ms windows containing homologous (striped bars) or non-homologous (gray bars) twitch movements at the left and right shoulder or elbow at P2 and P8. For this analysis only, only those windows containing two movements, one on each side of the body, were included. (C) Mean proportion of 100-ms windows containing twitches at homologous joints in the left and right forelimbs at P2 (black bars) and P8 (white bars). (D) Mean proportion of 100-ms windows containing 2, 3, 4, or 5 twitches at P2 (black bars) and P8 (white bars). See Figure S1 for a corresponding analysis in relation to chance. Events containing 0-1 twitches were excluded from this analysis. All means + SE. Abbreviations as in Figure 2. N = 7 (P2) and 6 (P8). * p < .05, ** p < .01.