
Figure 5. Hierarchical cluster analyses, with seriation, of multi-joint twitches at the shoulder and elbow of both forelimbs in (A) 2- and (B) 8-day-old rats.
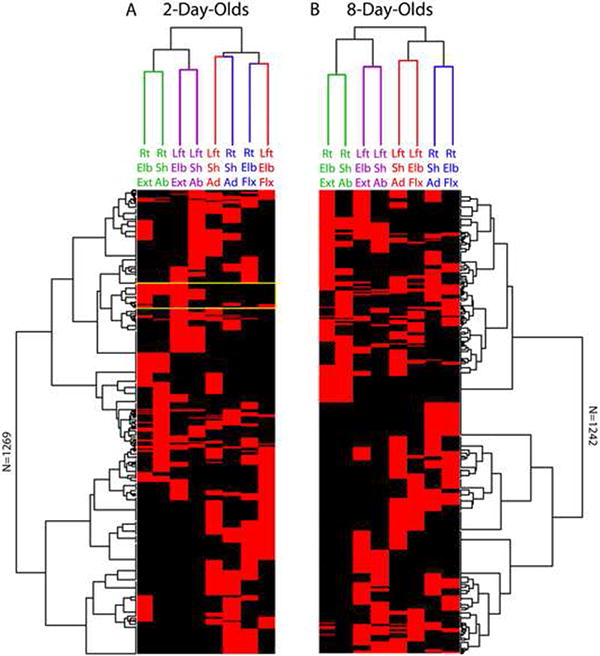
These analyses were performed on the 100-ms windowed dataset. Each row of data flows vertically down each figure, with red corresponding to the presence of a twitch and black to its absence. There are a total of 1269 rows (or events) at 2 days of age and 1242 rows at 8 days of age. In addition to the dendrograms depicted at the top of each figure depicting relationships among the joints, seriation is used to produce the dendrograms along the rows to reveal structure among the events in the data. The color-coding for the dendrograms at the top highlights similar and dissimilar clustering at the two ages. The yellow box is discussed in the text. For comparison with randomized data, see Figure S2. Abbreviations: Rt, right; Lft, left; Sh, shoulder; Elb, elbow; Ad, adduction; Ab, abduction; Flx, flexion; Ext, extension.