
Figure 6. Profile plots of multi-joint patterns of twitching identified using latent class analysis (LCA).
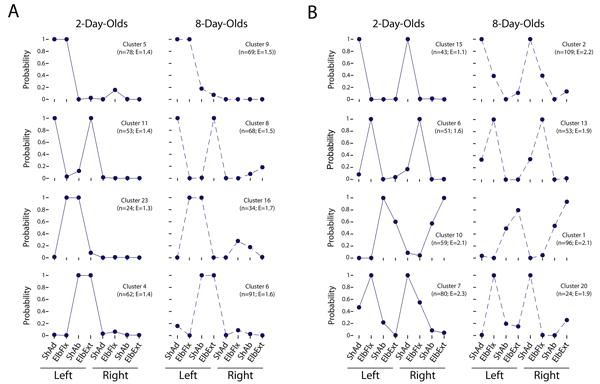
As in the hierarchical cluster analysis presented in Figure 5, the LCA analysis was performed using the 100-ms windowed dataset. In total, 28 clusters were identified at 2 days of age and 21 clusters were identified at 8 days of age. Subsequently, we used two methods to match similar clusters at the two ages (see Materials and Methods); only the profile plots for matched clusters are presented in the figure (out of a total of 18 match clusters). Each plot can be interpreted as the likelihood that, given the existence of a cluster, a particular joint movement would be included within it. The figure presents a sampling of profile plots for clusters comprised primarily of movements at (A) two joints and (B) more than two joints. For each cluster, its frequency (n) and entropy (E) are shown. Abbreviations: ShAd, shoulder adduction; ElbFlx, elbow flexion; ShAb, shoulder abduction; ElbExt, elbow extension.