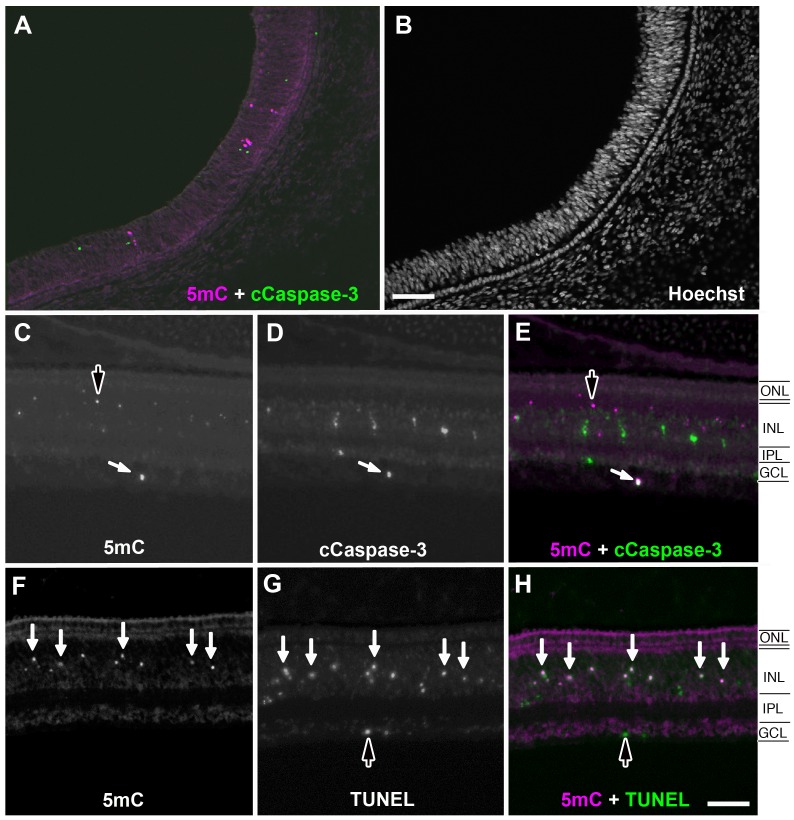
Figure 3. Comparison of cCaspase3 and TUNEL co-labeling with 5mC in the developing chicken retina.
(A) Low magnification of 5mC and cCaspase3 staining at E11. (B) Nuclear counterstaining of a low magnification section. (C) 5mC and (D) cCaspase3 staining. Colocalization of 5mC (+) and cCaspase3 (+) cells indicated by white arrows overlaid in (E). Dark arrows indicate 5mC (+) cells that are cCaspase3 (−). (F) 5mC and (G) TUNEL staining at E11. (H) Co-localization indicated by white arrows. TUNEL (+) but 5mC (−) indicated by a dark arrow. ONL = outer nuclear layer; INL = inner nuclear layer; IPL = inner plexiform layer; GCL = ganglion cell layer. Scale bars = 100 µM in A–B; 75 µM in C–H.

