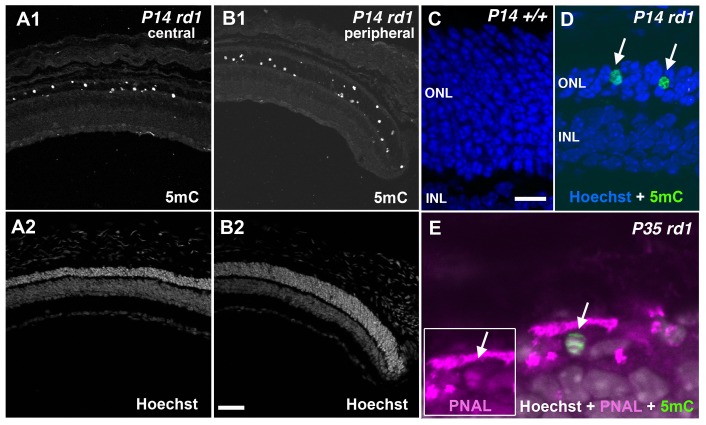
Figure 4. 5mC expression in the ONL of the rd1 mouse retinal degeneration model.
(A1, B1) 5mC labeling and (A2, B2) Hoechst labeling of the central and peripheral retina, respectively, of an rd1 mouse at P14 during the peak of rod degeneration. (C) Age-matched retinas from wild-type control and (D) rd1 mice, respectively, at P14 with Hoechst (blue) and 5mC (green) staining (arrows). (E) 5mC (green) and cone marker PNAL (magenta) staining co-localize (arrows) in a subset of cones in the remnants of the ONL. ONL = outer nuclear layer; INL = inner nuclear layer. Scale bars = 100 µM (B2) and 35 µM (C).

