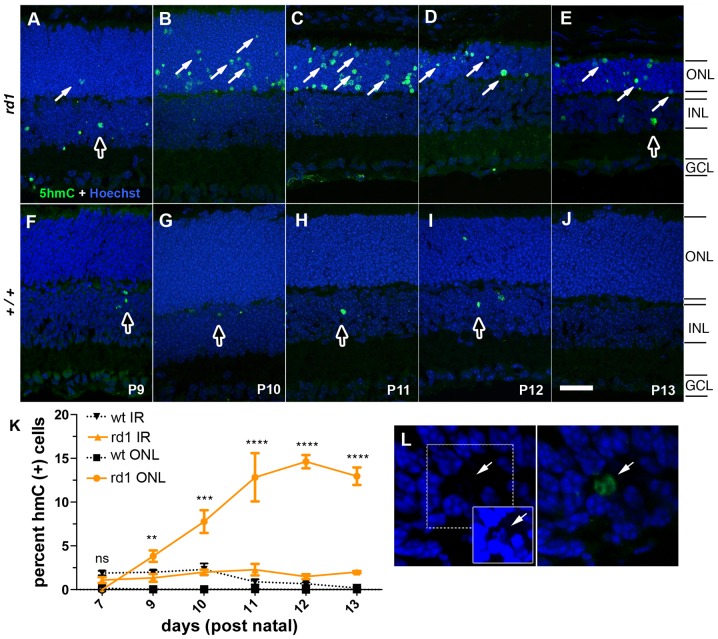
Figure 7. Detection of 5hmC during photoreceptor degeneration in the rd1 mouse.
(A–E) Rd1 or (F–J) wild-type mouse retinas, P9 through P13, were labeled with antibodies against 5hmC (A–J). White arrows indicate 5hmC (+) cells in the ONL, dark arrows indicate occasional (+) cells in the INL. (K) Quantification of percent positive cells in the outer or inner retina for wild-type (+/+) and rd1 are plotted as a function of days of age. (L) 5hmC (+) cells in the ONL with decreased staining for intercalating DNA dyes including Hoechst. The inset is the same image taken at a significantly higher gain. Black squares = +/+ ONL, black triangles = +/+ inner retina, orange circle = rd1 ONL, orange triangle = rd1 inner retina. Values are mean ± sem. ns = not significant, ****p<0.0001 versus wild type. ONL = outer nuclear layer; INL = inner nuclear layer; GCL = ganglion cell layer. Scale bar (A) = 25 µM.

