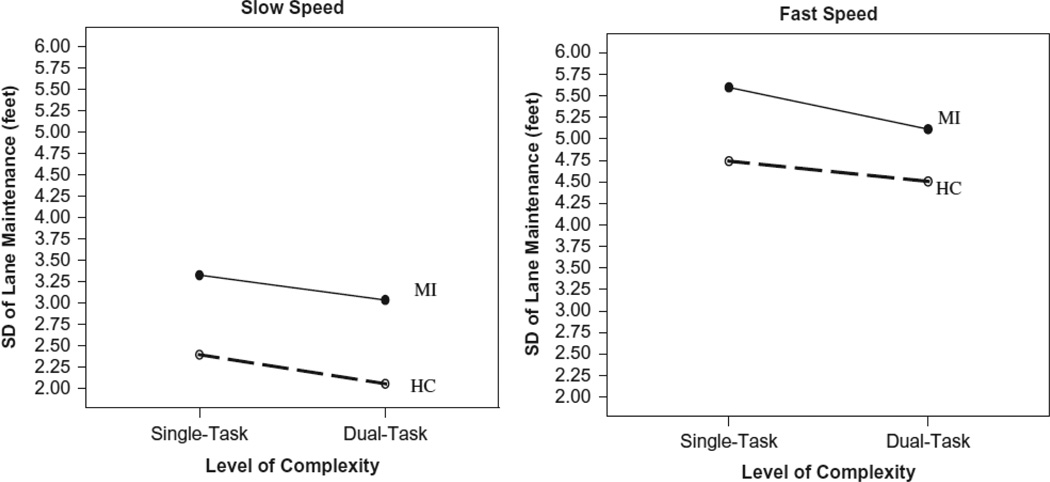
FIGURE 1.
Line graphs of level of difficulty and level of complexity by impairment status for standard deviation of lane maintenance (feet). Memory Impaired participants (MI) show more variability in lane maintenance than controls (HC), and participants showed more variability at fast speeds than at slow speeds. However, under dual-task conditions, participants showed marginally less variability when a secondary memory task was added.

