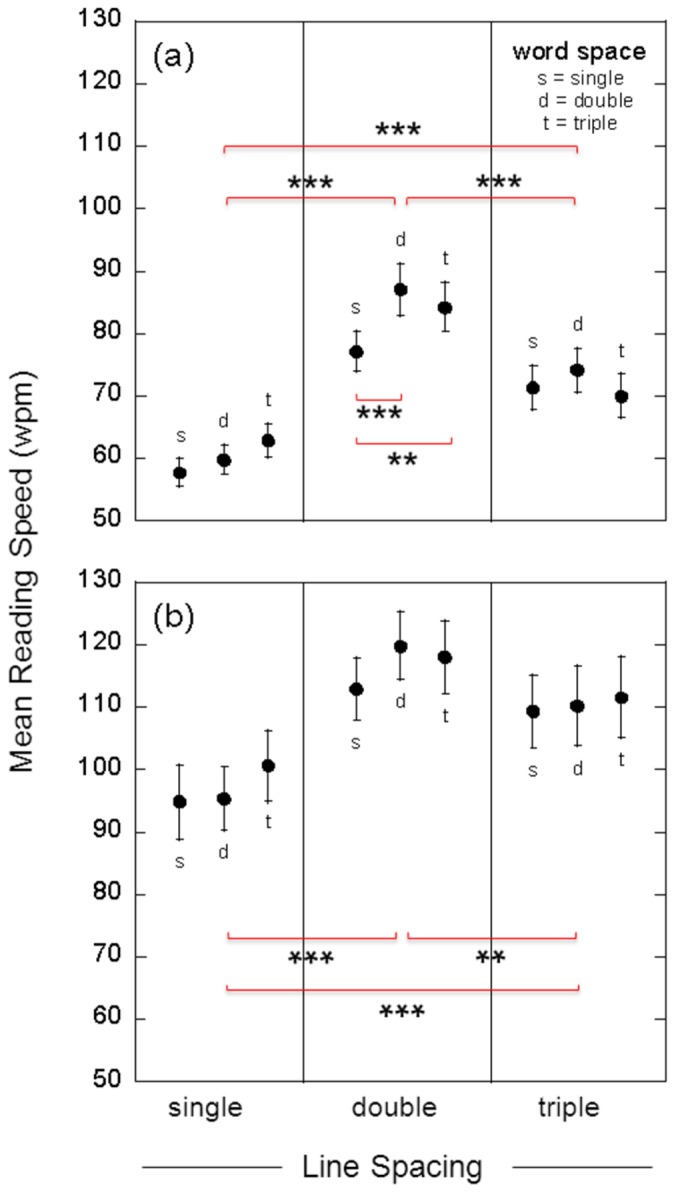
Figure 5. Group-mean reading speeds.

Group mean (n = 24) reading speeds (words per minute, wpm) for single, double and triple line spacing. Results are shown for both low contrast text (17.5%, panel a) and high contrast text (87.5%, panel b). For each line spacing, results are shown for single- (s), double- (d) and triple-character (t) word spacing. Error bars show +/- one standard error. Statistical analysis of the data, using a two-way repeated measures ANOVA, is reported in the text. The horizontal red brackets indicate significant differences between conditions, as determined using post-hoc comparisons with Tukey’s HSD test. Shown are the significant differences in mean reading speed between line spacing conditions (averaged across word spacing), and the significant differences between word spacing conditions for low contrast text displayed with double line space (**, p < 0.01; ***, p < 0.001).
