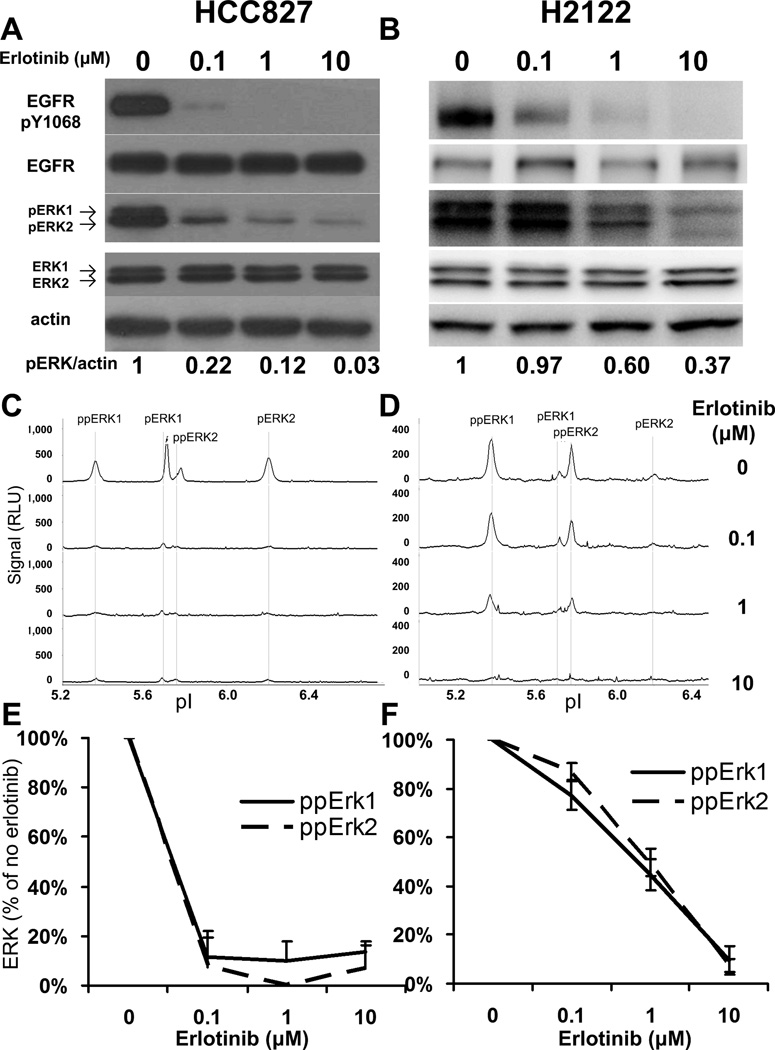
Figure 1. Profiles of ERK1/2 phosphorylation in erlotinib treated HCC827 and H2122 cells.
Cells were treated with indicated concentrations of erlotinib, followed by 20 ng/ml EGF stimulation. (A) and (B) Western blot showing phospho-EGFR and phospho-ERK response to erlotinib dosing in HCC827 and H2122 cells, respectively. 30 µg of protein lysate were loaded for each sample. Semi-quantitation of phospho-ERK1/2 intensities, calibrated by actin intensity, was provided at bottom of images. (C) and (D) NanoPro showing the profiles of phospho-ERK1/2 isoforms and their response to erlotinib dosing in HCC827 and H2122 cells, respectively. 30 ng of protein lysate were loaded for each sample. (E) and (F) Quantitation of dual-phospho ERK1/2 signal intensities as percentage of no drug treatment control in (C) and (D), respectively. Error bars are standard deviations from triplicate analysis.

